Why Your Cloud Bill Resembles a Kafka Novel
After spending the better part of fifteen years watching engineering teams discover their AWS bill has somehow achieved sentience and learned to compound monthly, I’ve noticed a pattern. Most cost optimization advice reads like it was written by someone who thinks Reserved Instances are just EC2 machines that went to finishing school. The reality is messier, and way more interesting if you enjoy the kind of mathematical precision that makes accountants weep tears of joy.
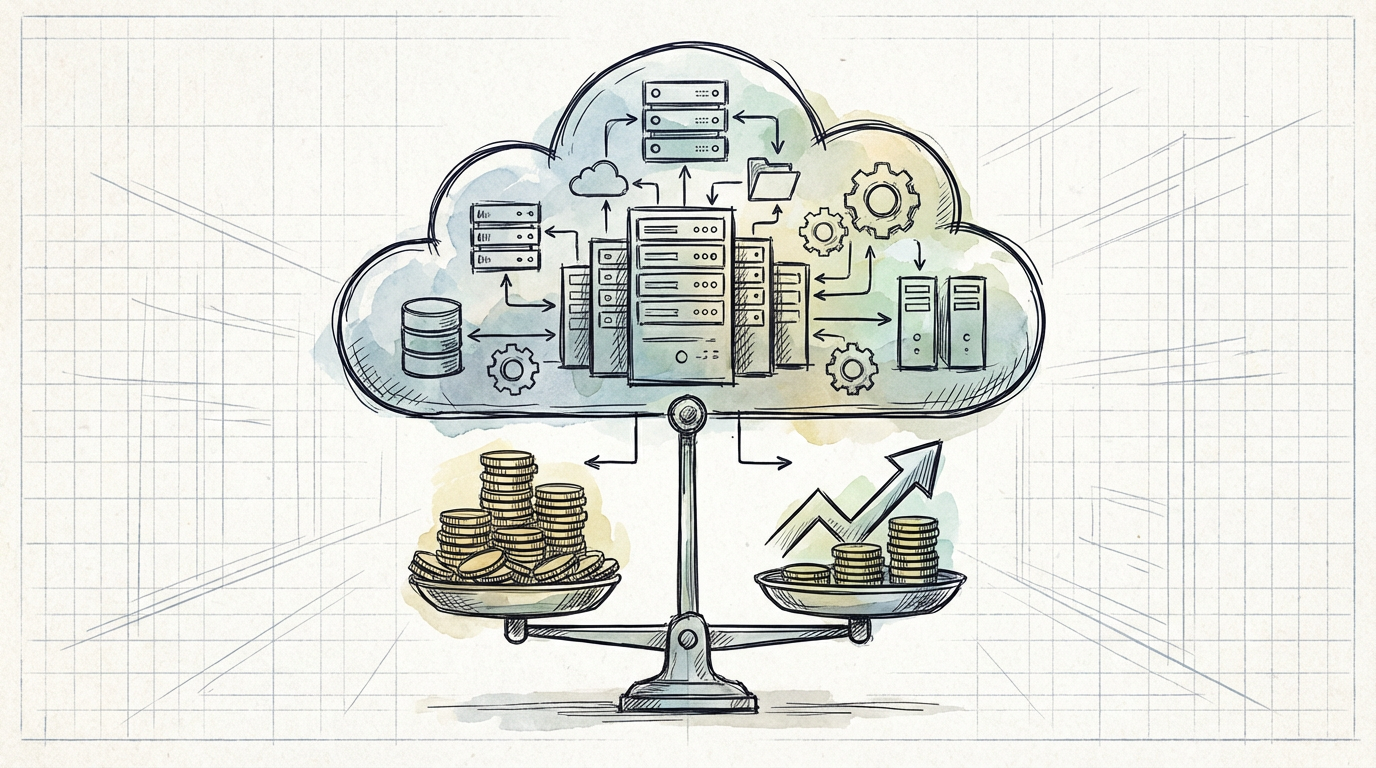
Cloud cost optimization isn’t about turning off the lights when you leave the room. It’s about understanding the economic models that cloud providers use to price their services, then exploiting those models legally and ethically. Think of it as arbitrage for infrastructure nerds. The most elegant solutions pop up when you stop thinking about individual services and start thinking about the underlying resource allocation patterns.
The first principle worth understanding is that cloud providers operate on economies of scale that would make 19th-century railroad barons envious. They’ve built pricing models that reflect their operational realities, not necessarily yours. Your job is to align your usage patterns with their cost structures, which requires understanding both the technical and economic constraints they’re optimizing for.

The Hidden Geometry of Instance Sizing
Here’s where most teams commit what I like to call the “Goldilocks fallacy.” They assume that a medium instance costs half of a large instance, which costs half of an extra-large instance. This would make sense in a rational universe, but cloud pricing follows the economics of hardware procurement and data center thermal dynamics, not your intuitive sense of fairness.
The actual cost curves are step functions with weird plateaus. A c5.large instance costs $0.085 per hour in us-east-1, while a c5.xlarge costs $0.17. That’s exactly double, which seems reasonable. But here’s the interesting part: the c5.xlarge has 4 vCPUs versus the c5.large’s 2 vCPUs, and 8GB of memory versus 4GB. You’re getting twice the compute and memory for exactly twice the price. This seems fair until you realize that most applications can’t efficiently use that perfect doubling.
The mathematical sweet spot often lives in understanding your application’s actual resource consumption patterns, not its theoretical requirements. I’ve seen applications that claimed they needed 8GB of memory running comfortably on instances with 4GB, simply because the team had never actually measured their working set size. The gap between theoretical and actual resource consumption is where real optimization happens.
Understanding the relationship between network performance, storage IOPS, and instance size reveals optimization opportunities that aren’t obvious from the pricing page. Smaller instances often have proportionally better price-performance ratios for network-bound workloads, while larger instances excel at compute-heavy tasks. The key is matching your workload’s bottleneck to the instance type’s strength.
The Economics of Temporal Arbitrage
Reserved Instances and Spot Instances represent two different forms of temporal arbitrage, and understanding the mathematics behind each reveals when they’re actually helpful versus when they’re expensive theater. Reserved Instances are loans you’re making to AWS in exchange for a discount. The implicit interest rate varies wildly depending on the term and payment structure.
A three-year All Upfront Reserved Instance for a c5.large in us-east-1 costs roughly $1,389 upfront versus $744.60 annually for On-Demand pricing. That’s a 37% discount, but you’re paying three years in advance. The implicit interest rate works out to approximately 18% annually, which means Reserved Instances only make financial sense if your cost of capital is higher than 18% or if you’re absolutely certain about your long-term capacity requirements.
Spot Instances operate on different mathematics entirely. They’re priced based on supply and demand within specific Availability Zones and instance types. The key insight is that Spot pricing has predictable patterns based on business hours, geographic distribution of workloads, and seasonal demands. Applications that can tolerate interruption and restart elsewhere can achieve 70-90% cost reductions by riding these pricing waves intelligently.
The most sophisticated approach combines all three pricing models strategically. Run your baseline, predictable workloads on Reserved Instances. Handle traffic spikes with On-Demand capacity. Use Spot Instances for batch processing, development environments, and any workload that can checkpoint and resume. The mathematics becomes a portfolio optimization problem rather than a simple cost-cutting exercise.
Storage Optimization Through Information Theory
Cloud storage pricing structures reveal some beautiful applications of information theory, if you know where to look. The relationship between access patterns, durability requirements, and cost follows principles that would be familiar to anyone who’s studied Shannon’s work on information entropy.
S3’s storage classes represent different trade-offs between access latency, retrieval costs, and storage costs. Standard storage costs $0.023 per GB in us-east-1, while Glacier Instant Retrieval costs $0.004 per GB but charges $0.03 per 1,000 retrieval requests. The mathematical break-even point depends on your access frequency, but it’s not intuitive.
For data accessed less than once per month, Glacier Instant Retrieval becomes cost-effective. For data accessed less than once per year, Glacier Flexible Retrieval at $0.0036 per GB makes sense despite the longer retrieval times. The key insight is that most applications have data with highly skewed access patterns following something approximating a power law distribution. The majority of your data is accessed infrequently, making aggressive lifecycle policies surprisingly effective.
Block storage optimization follows similar principles but with different constraints. EBS gp3 volumes separate IOPS and throughput from storage size, which means you can provision exactly the performance you need rather than over-provisioning storage to get adequate IOPS. A 100GB gp3 volume with 10,000 IOPS costs $11.60 monthly, while achieving the same IOPS with gp2 would require a 3,334GB volume costing $334 monthly. The mathematics strongly favor understanding your actual performance requirements.
Network Traffic: The Silent Budget Killer
Data transfer costs are the most overlooked optimization opportunity in most cloud deployments. AWS charges $0.09 per GB for data transfer out to the internet, which seems negligible until you realize that a single 1080p video stream consumes roughly 3GB per hour. Scale that to real-world traffic patterns, and data transfer can easily become 20-30% of your total cloud spend.
The mathematics of CDN optimization becomes critical at scale. CloudFront charges vary by geographic region, ranging from $0.085 per GB in North America to $0.140 per GB in India. For applications with global reach, intelligent routing and caching strategies can reduce both latency and costs simultaneously. The key insight is that CDN edge locations aren’t just about performance, they’re about shifting traffic to lower-cost regions.
Understanding the difference between inter-AZ and intra-AZ data transfer costs reveals architectural optimization opportunities. Data transfer between Availability Zones costs $0.01 per GB in each direction, while data transfer within an AZ is free. Applications that can maintain data locality while preserving high availability can achieve significant cost reductions through careful service placement.
The most elegant solutions often involve rethinking data flow patterns entirely. Instead of treating data transfer as a fixed cost, design systems that minimize unnecessary data movement through techniques like edge computing, intelligent caching, and data locality optimization. The mathematics reward architectures that keep data close to where it’s consumed.
Understanding these underlying economic models transforms cost optimization from a reactive exercise to a proactive design principle. The teams that consistently achieve the lowest cloud costs aren’t necessarily the ones that monitor their bills most carefully, they’re the ones that understand the mathematical relationships between usage patterns and pricing structures well enough to design systems that naturally align with cost-effective resource utilization. What patterns have you noticed in your own cloud spending that might reveal deeper optimization opportunities?